
What cities actually want
City transportation leaders are not asking for clean data for its own sake. They are asking operational questions:
- Which curb zones are underutilized, and how do we reallocate them?
- Where are delivery vehicles creating the most congestion, and what policy change would reduce it?
- Which intersections carry the highest injury risk, and which intervention returns the most per dollar?
The gap is not between data and dashboards. It is between dashboards and decisions.
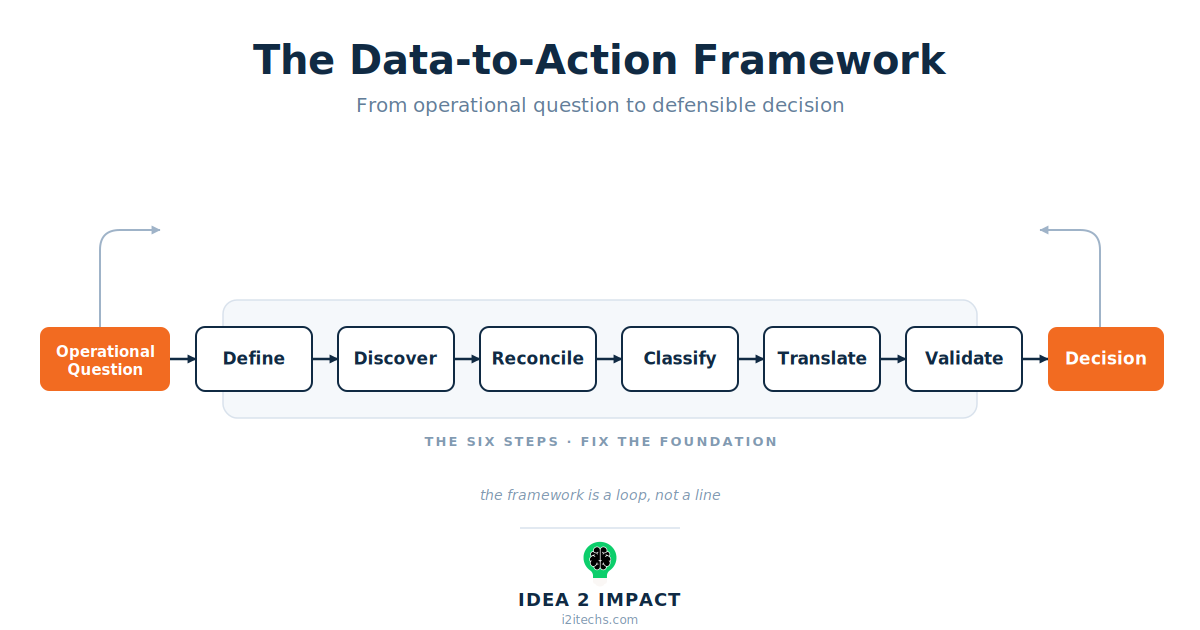
Introducing the Data-to-Action Framework
Across multiple city data engagements, including production pipelines for SFMTA and the City of Minneapolis, we developed a repeatable transportation data pipeline framework for turning fragmented data into something that actually answers those questions. Millions of records spanning curb regulations, street closures, towaway zones, and asset inventories. We call it the Data-to-Action Framework. It has six steps, and each one earns the next. Skip any of them and the project fails in production.
Step 1: Start with the question, not the data
Before you touch a dataset, name the decision it is supposed to support. This sounds obvious. It rarely gets done. The question determines everything downstream: which records are relevant, which standards apply, what validation means, and what done looks like. Without it, discovery has no filter and validation has no success criteria. Defining the question is only half the work. Combining the right clean datasets to produce the metric that actually answers it is its own discipline. That is the subject of the next post in this series. For now, the rule is simple: define the question first, and let everything else follow from it.
Step 2: Understand what you actually have
Once you know what you are trying to answer, you can assess whether your data is capable of answering it. Discovery surfaces four categories of problems.
Labeling and location inaccuracies. An asset exists in the system but its coordinates are wrong, outdated, or imprecise. Your options: reference other fields to infer a better location, combine fields across sources to triangulate position, or flag the record for ground truth capture.
Errant records. Bad timestamps, duplicates, missing fields, references to assets no longer in service. Do you drop them, flag them, or repair them? The answer depends entirely on the question you defined in Step 1.
Cross-dataset disagreements. In one engagement, inventory details such as location lived in a different system than the policies that governed them, and the two did not always agree. Inventory records with no matching policy. Policies with no physical asset. Rules that conflicted and could not be reconciled automatically. We also found asset locations mapped correctly while pricing data was connected nowhere in the dataset. Discovery surfaces these gaps before they become runtime failures.
Conflicting datasets that must be merged. We have inherited multiple datasets for the same asset: a legacy system no longer maintained alongside a newer one that was more current but missing records. Reconciling them required a four-step process. Scan for usable, duplicate, and sparse records. Fix what can be fixed by merging external reference data and decoding column codes nobody documented. Discard redundant records while migrating valuable data to the surviving one. Flag anything that cannot be fixed programmatically for ground truth verification.
Discovery is also where you filter. Datasets are never pre-scoped to your use case. A street sign inventory contains every sign type, but only a subset is relevant to the question from Step 1. Identify what belongs in the pipeline before you build anything downstream.
Step 3: Fix what is broken before you transform anything
Reconciliation is the work nobody plans for and everybody underestimates. Spatial accuracy is where it shows up most visibly. We have seen assets offset by 20 to 50 meters in production. Coordinates placed in the ocean. Assets marked active that were removed years ago. Records where one entry represented a single asset and another represented twelve, with a quantity field nobody documented. When spatial drift is significant, no inference algorithm fixes it. You need eyes on the ground or a visual verification tool such as Google Street View, OpenStreetMap, or Mapillary, with a collection process that enforces accuracy from the point of capture. We have seen segment-based mapping approaches reduce location uncertainty from tens of meters to single-digit meters. That is the difference between data you can act on and data you can only store.
Step 4: Group like data before you transform it
This is the step that gets skipped most often. It is also the one that makes everything else reliable. Before translation, group your data by meaningful dimension. Not arbitrary buckets. Groupings that reflect how the data actually behaves differently in transformation. Curb rules make this concrete. A rule allowing hourly metered parking with a two-hour maximum translates differently than a rule restricting a zone to buses. Treat them as the same input and you will write transformation logic that handles neither well. Group first by rule type, then build translation logic per group. That is how you catch edge cases systematically instead of discovering them in production. It also gives you measurability. When one rule type translates cleanly and another keeps failing, you know exactly where to look. You can track progress per group, surface known limitations, and propagate fixes without touching logic that is already working. The same principle applies outside city data: any pipeline with varied record types benefits from a classify step before translation. You will write less code, catch more errors, and have a cleaner picture of where the gaps actually are.
Step 5: Map to the target output structure
Only once data is clean, reconciled, and classified does it get mapped to the standard downstream systems consume. This is where CDS, MDS, and GTFS finally enter the picture: the open standards that define how curb, mobility, and transit data should be structured. Not as the first step, but as the destination. This layer also solves the multi-source problem. Data arrives from systems that each have their own schema, naming conventions, and formats. Translation brings them into one common structure the downstream system can actually use. A temporary street closure ends up shaped the same as a towaway zone. One city team described exactly this gap: their OCR pipeline was producing output that could not connect to their existing data standards without a translation layer. That translation layer is exactly what this step produces.
Step 6: Make sure the output reflects reality
Schema validation catches malformed output. It will not catch a loading zone the city reclassified six months ago, a policy referencing a segment that no longer exists, or a record that passes every format check but represents an asset nobody can find in the field. Validation happens at three layers:
- Schema – does this conform to the target standard?
- Spatial – does this geometry make sense on the ground?
- Semantic – does this match the authoritative source records?
The semantic layer is where the real errors live. It is also the hardest to build, because it requires understanding what the source of truth actually is and how to query it.
The framework is a loop, not a line
You do not run this once. You run it to answer a question, and the answer becomes the input to the next pipeline. A city asking where delivery vehicle demand exceeds curb supply cannot start with the curb data. It first has to run the framework to derive where demand is concentrated, then run it again to analyze that demand against available supply. That layering is what separates a durable data practice from a one-off analysis.
How you combine those clean datasets to produce the metric you are actually after is the subject of the next post.
The payoff
Once the foundation is in place: clean records, accurate geometry, classified inputs, translated schemas, validated output. The operational questions become answerable. Where is delivery vehicle demand exceeding curb supply? Which zones do we adjust? Which intersections do we fund first? For SFMTA alone, we processed more than 2.4 million source records across five datasets. Not all of them made it through. That is the point. The end goal was never more data, and it was never another dashboard. Cities have a decision problem, not a data problem. The foundation is what turns the data they already have into decisions they can defend.
If your team is collecting transportation data but still cannot answer its operational questions, the problem is probably not analytics. It is the foundation underneath. That is exactly what we build.